Sift
CSV to dashboard in seconds

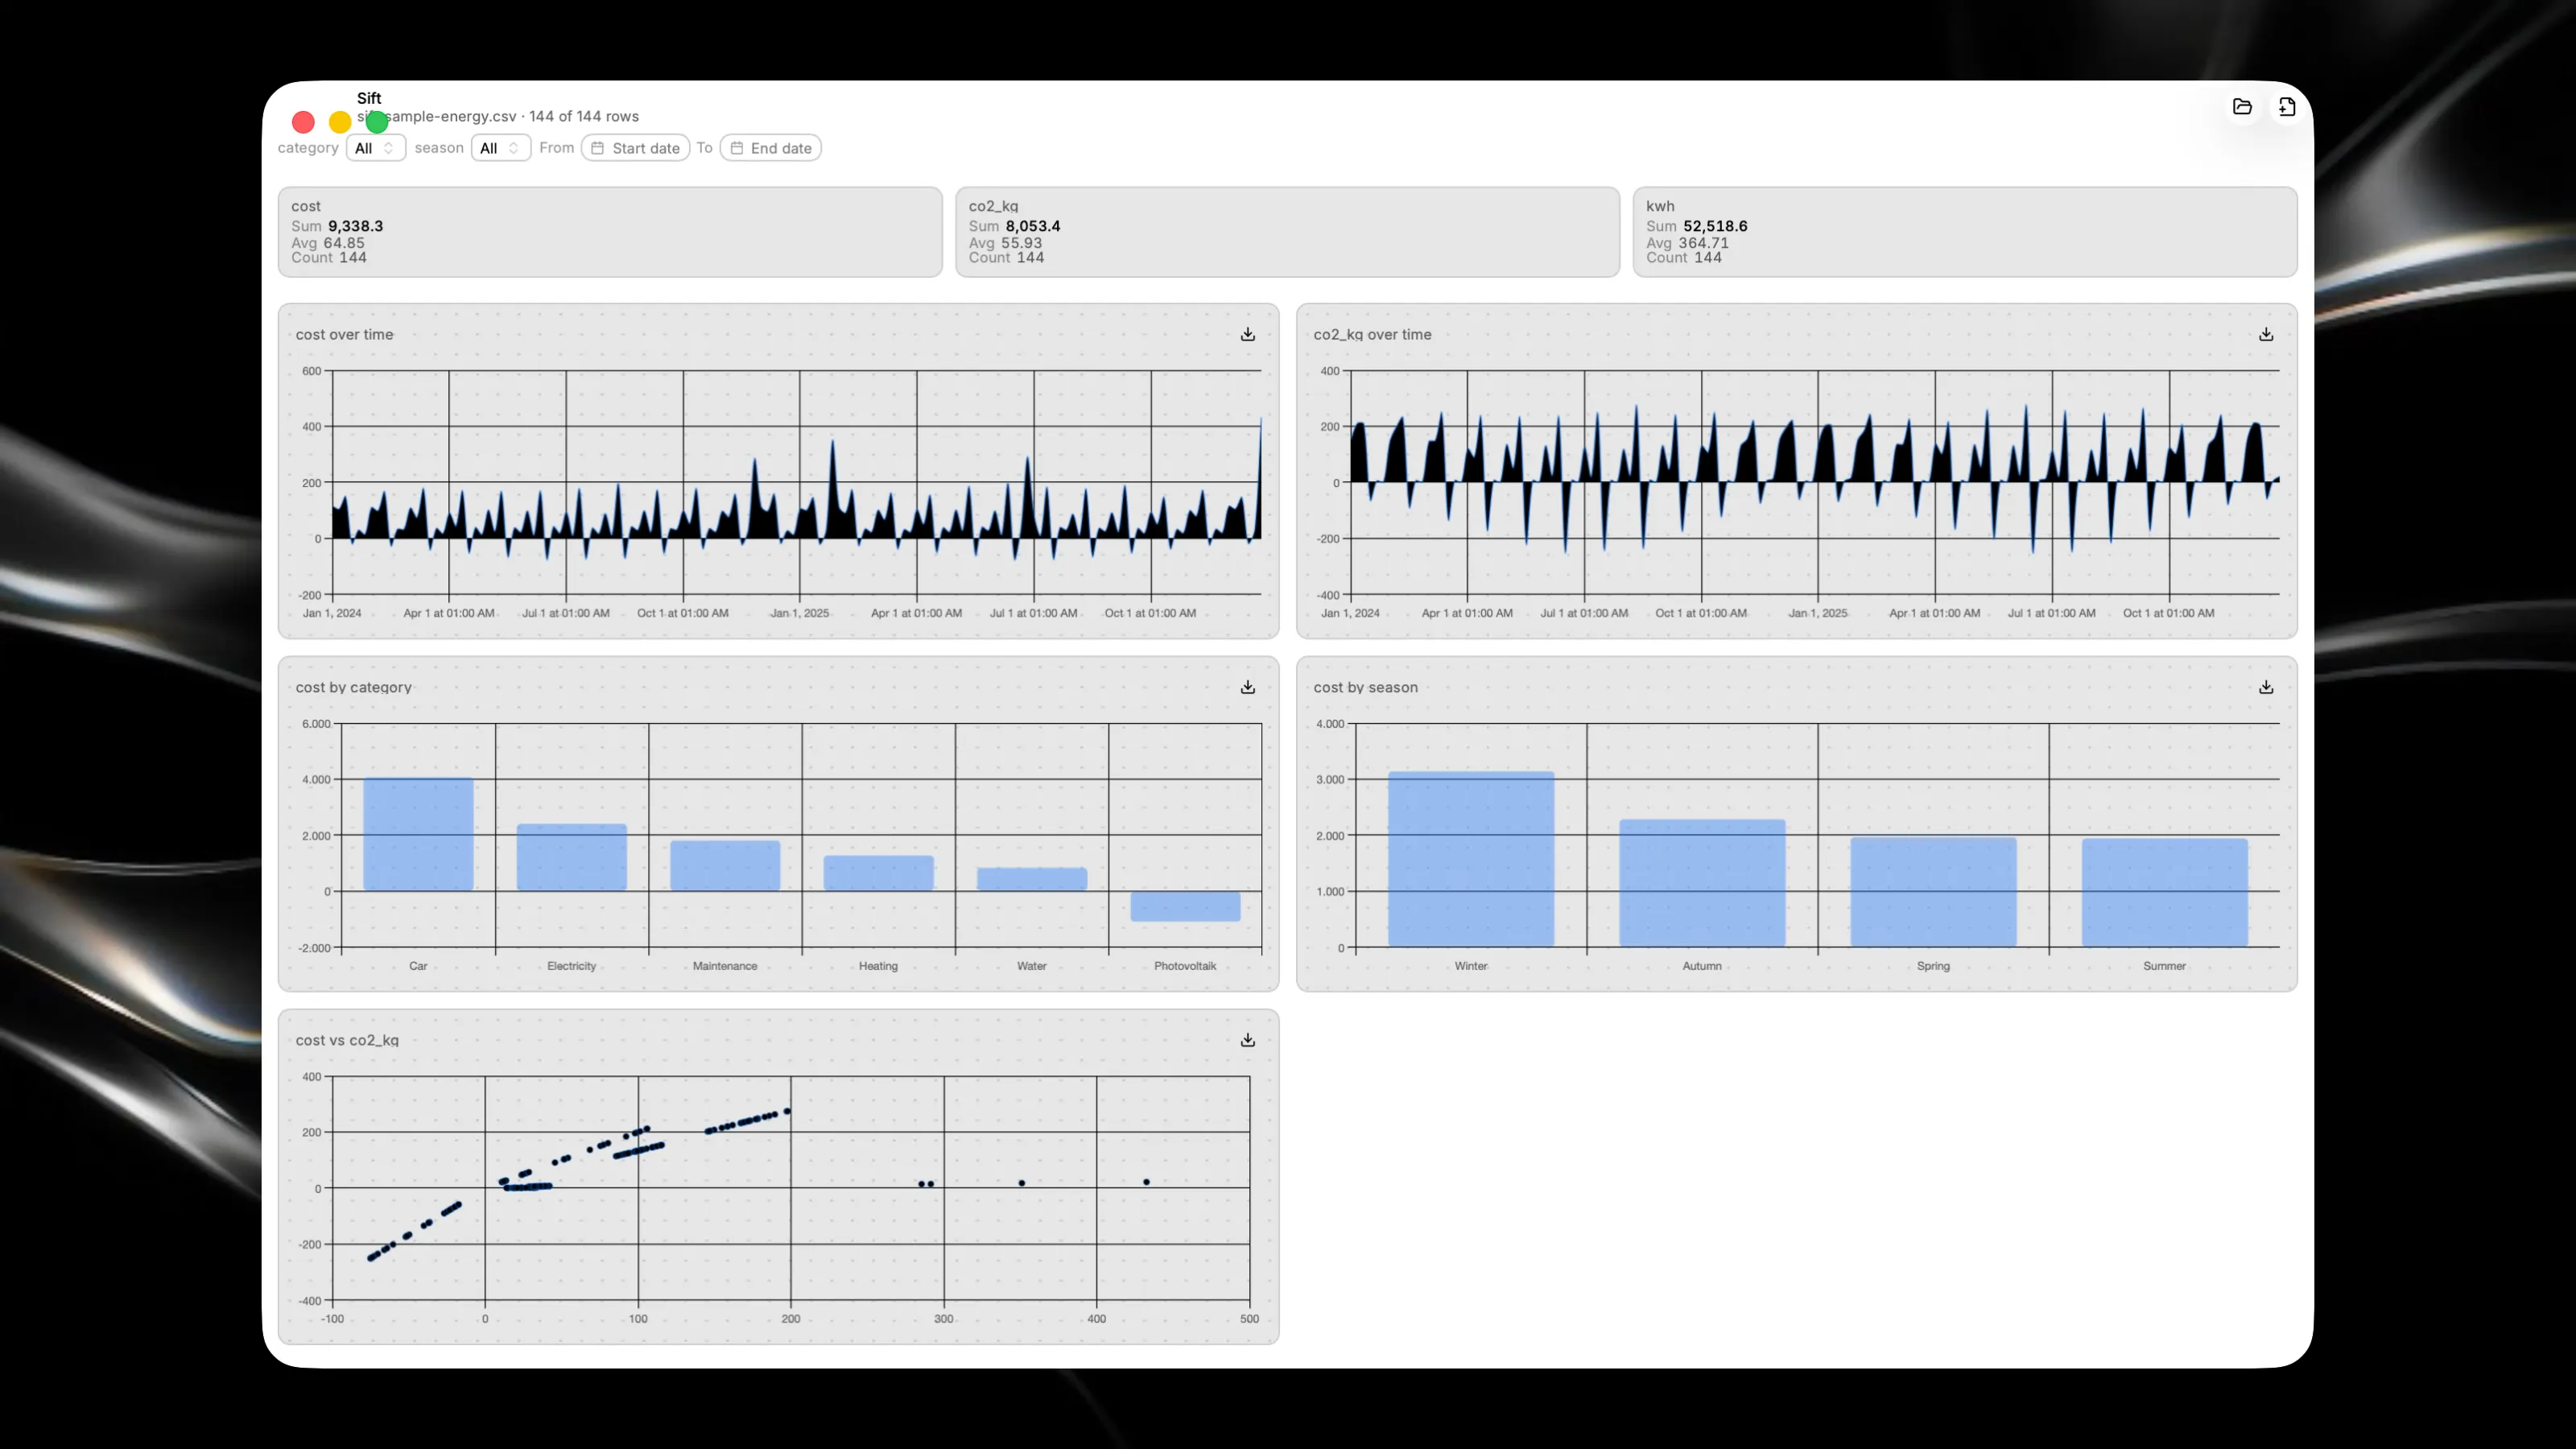
Transform your CSV files into interactive dashboards instantly. Open any spreadsheet and automatically generate charts, KPIs, and visualizations without manual setup. Key Features: - Visualize data with line charts, bar charts, and scatter plots that update in real-time as you filter - Extract key metrics like sums, averages, and counts automatically from numeric columns - Filter by date ranges and category values to focus on specific data subsets - Export your dashboard visualizations as PNG images for sharing and reporting
Suggested Apps
Mac Setup
Sync your Mac setup
 Nichlas Wærnes Andersen
Claude Usage
Monitor Claude Pro usage and reset time
Plain
Plain is a simple roadmap tool: create projects, set a status, see the timeline, tick the tasks. Clear priorities and visible progress—plain and simple.
 Kristina Loewen
Contact Diff
Instantly find and fix duplicates