Sift
Turn raw data into insights instantly

About Sift
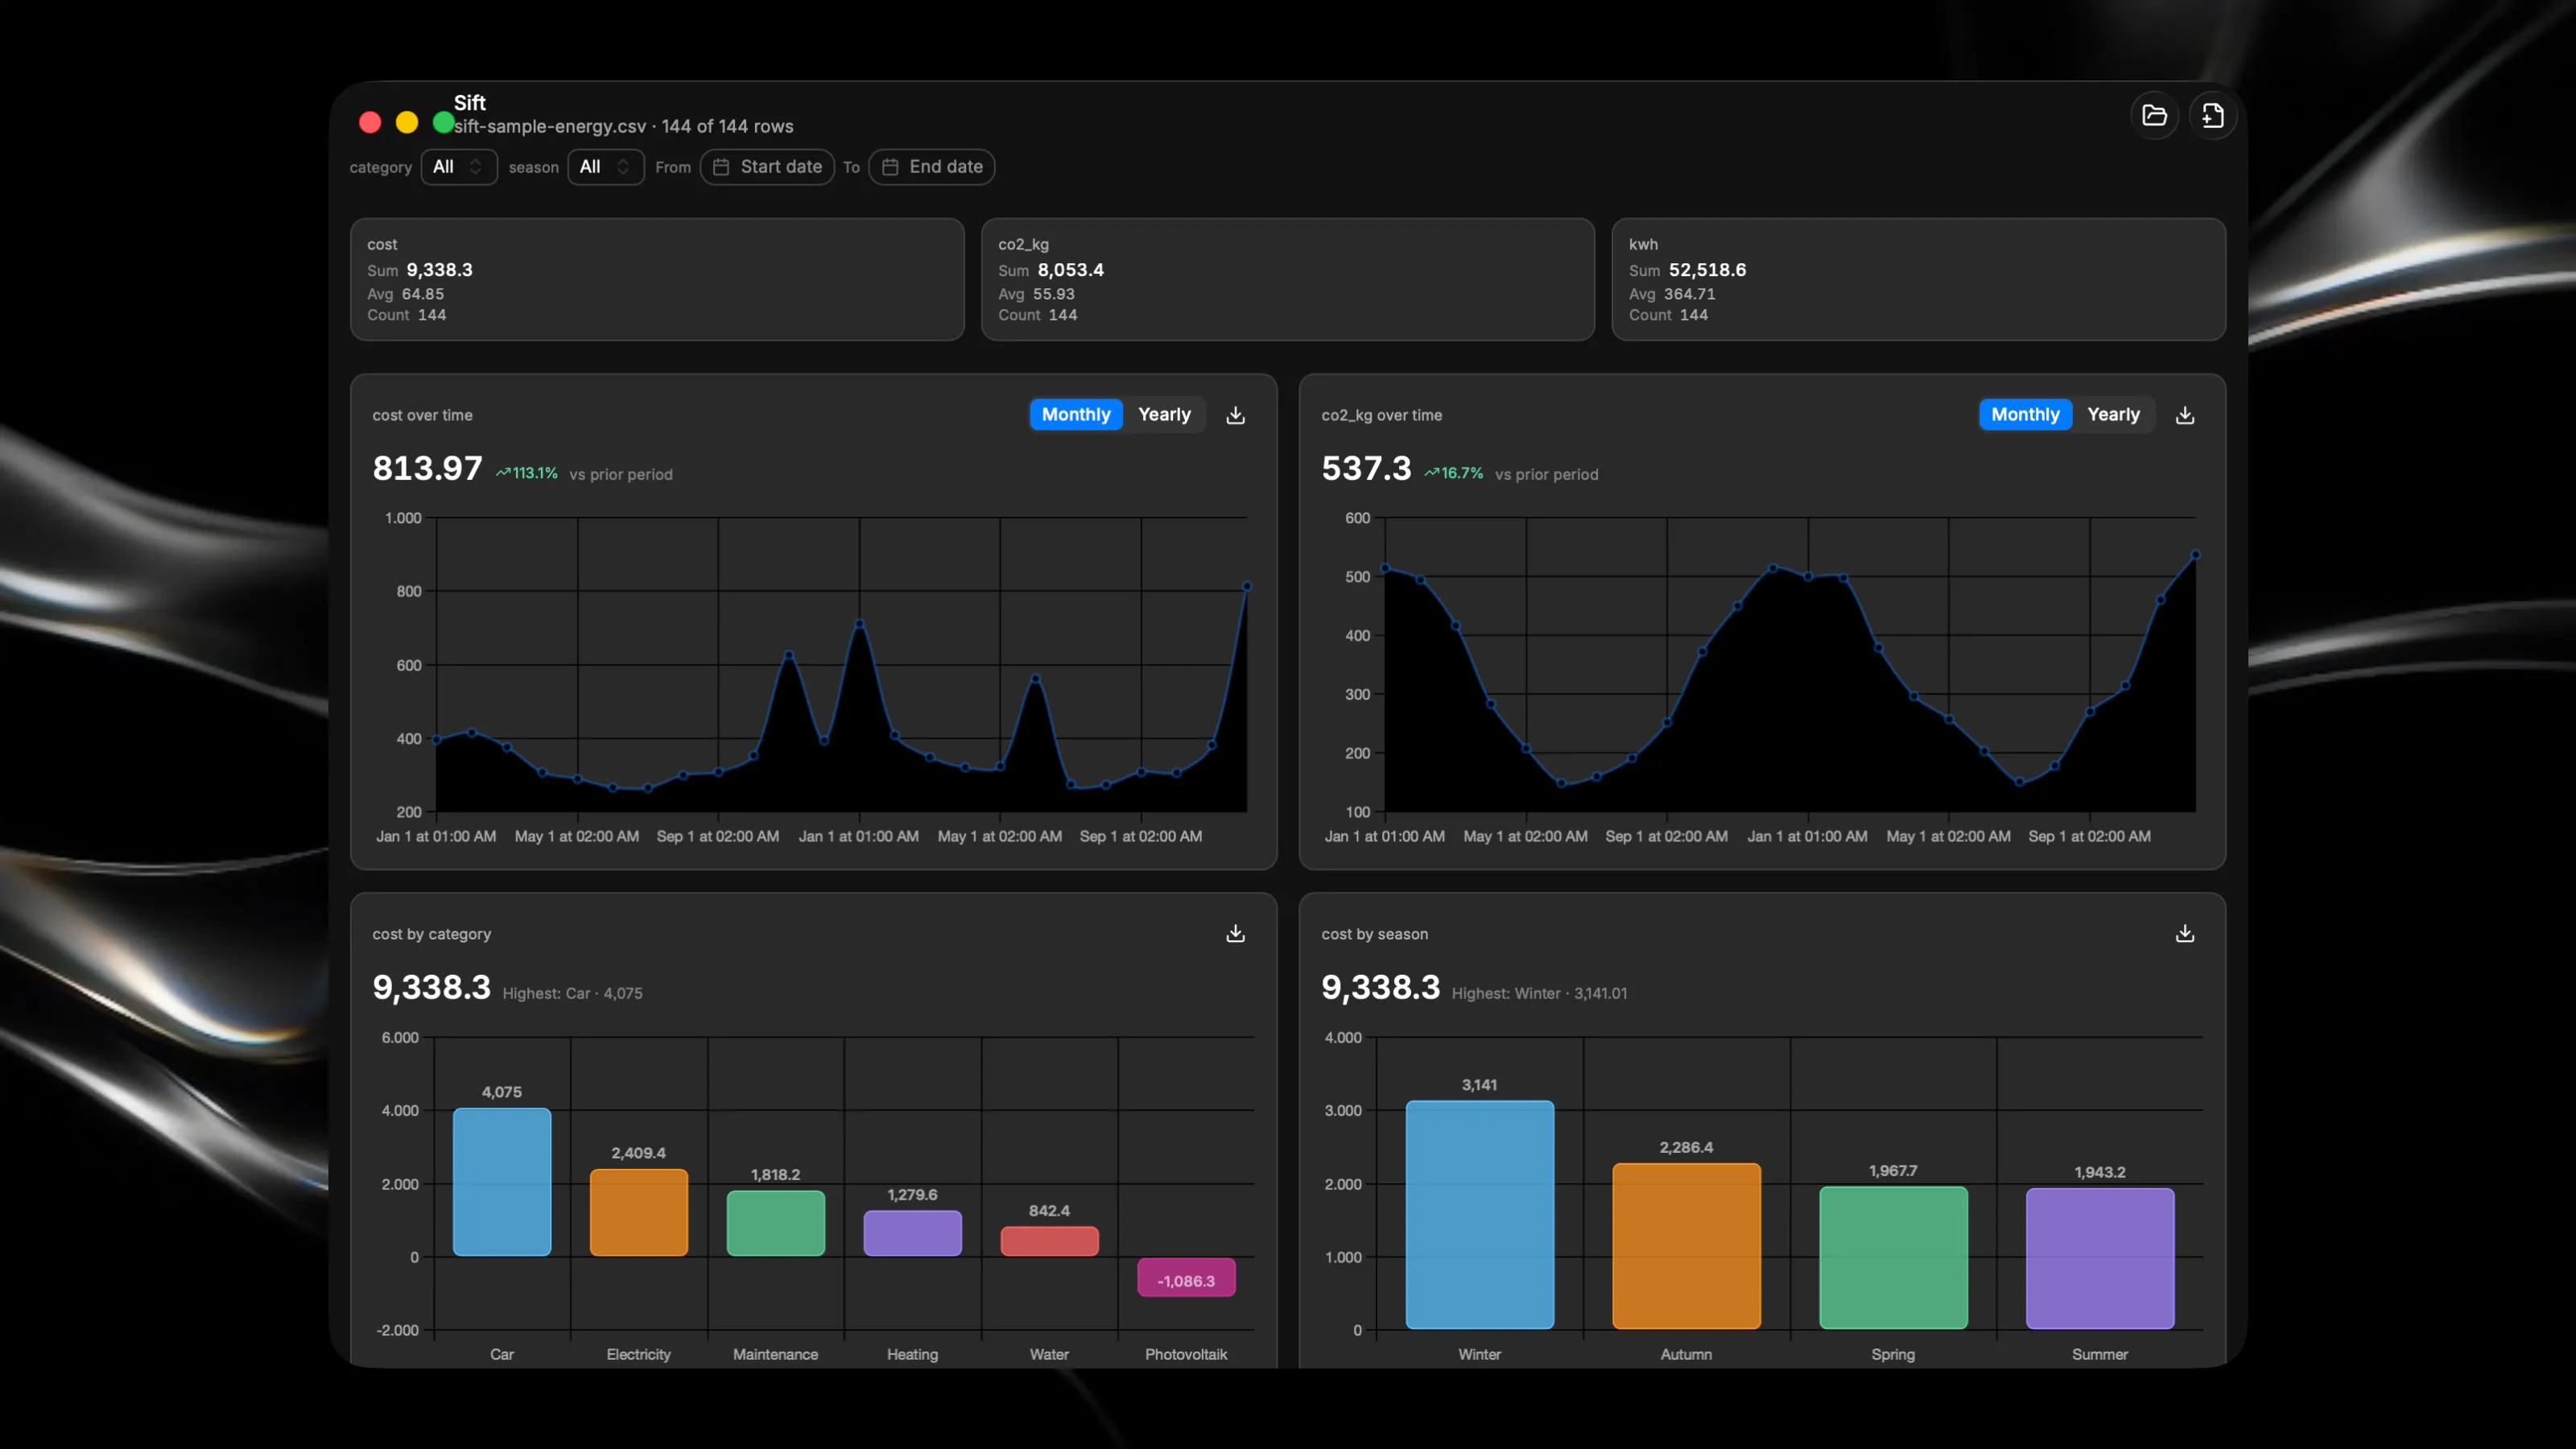
Transform your CSV files into interactive dashboards instantly. Open any spreadsheet and get automatic charts, filters, and key metrics in seconds. Key Features: - Visualize data with line charts, bar charts, and scatter plots that update as you filter - Filter by categories and date ranges to focus on exactly what matters - View key metrics like sum, average, and count across your numeric columns - Export charts as PNG images for reports and presentations